The air you actually breathe — tracked, measured, and ready to share with your doctor.
Air quality, pollen & exposure.
SEE THE AIR. BREATHE EASY.
Most people don't know what they're breathing. Until it matters.
BreatheMap shows you the air quality at every place you spend time — home, work, school, the park — and builds your personal exposure history automatically. Not a city forecast. Your air. Your data. Your story.
YOUR AIR, RIGHT NOW.
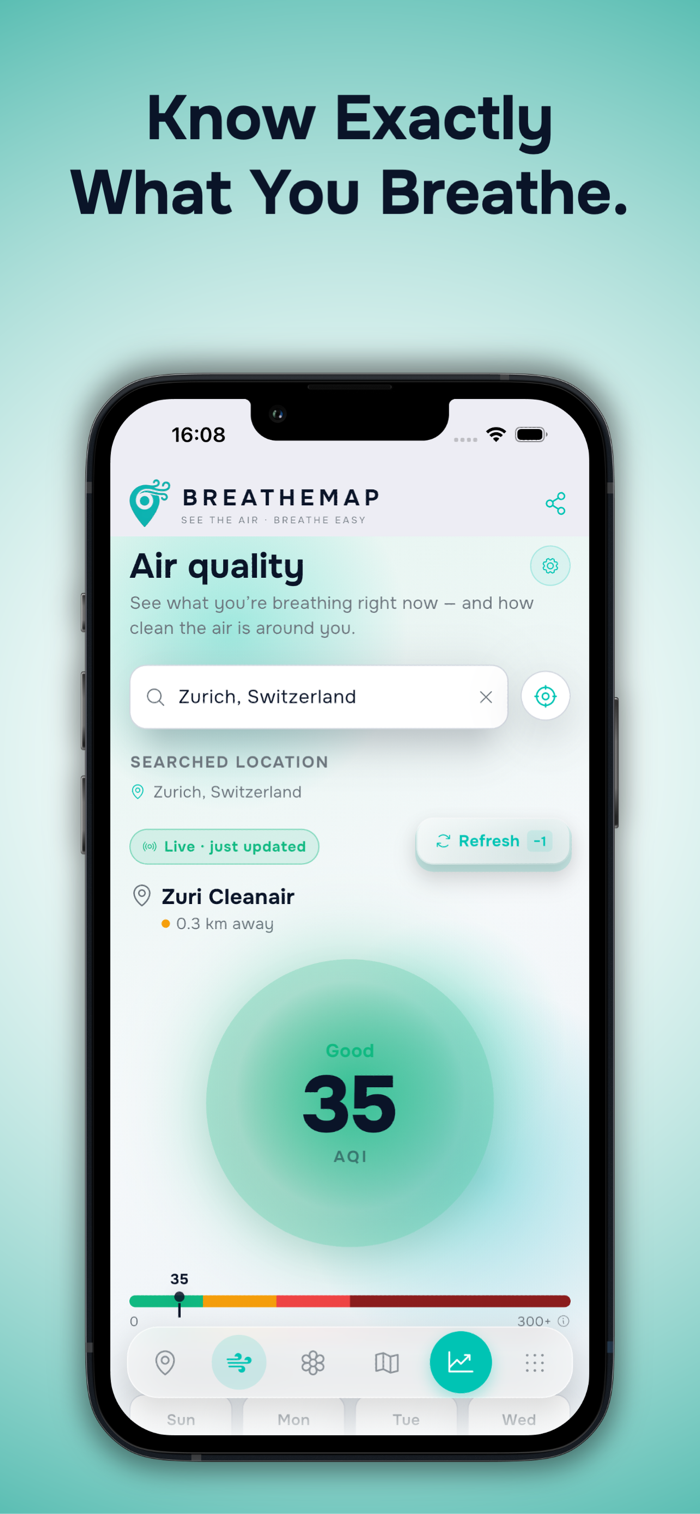
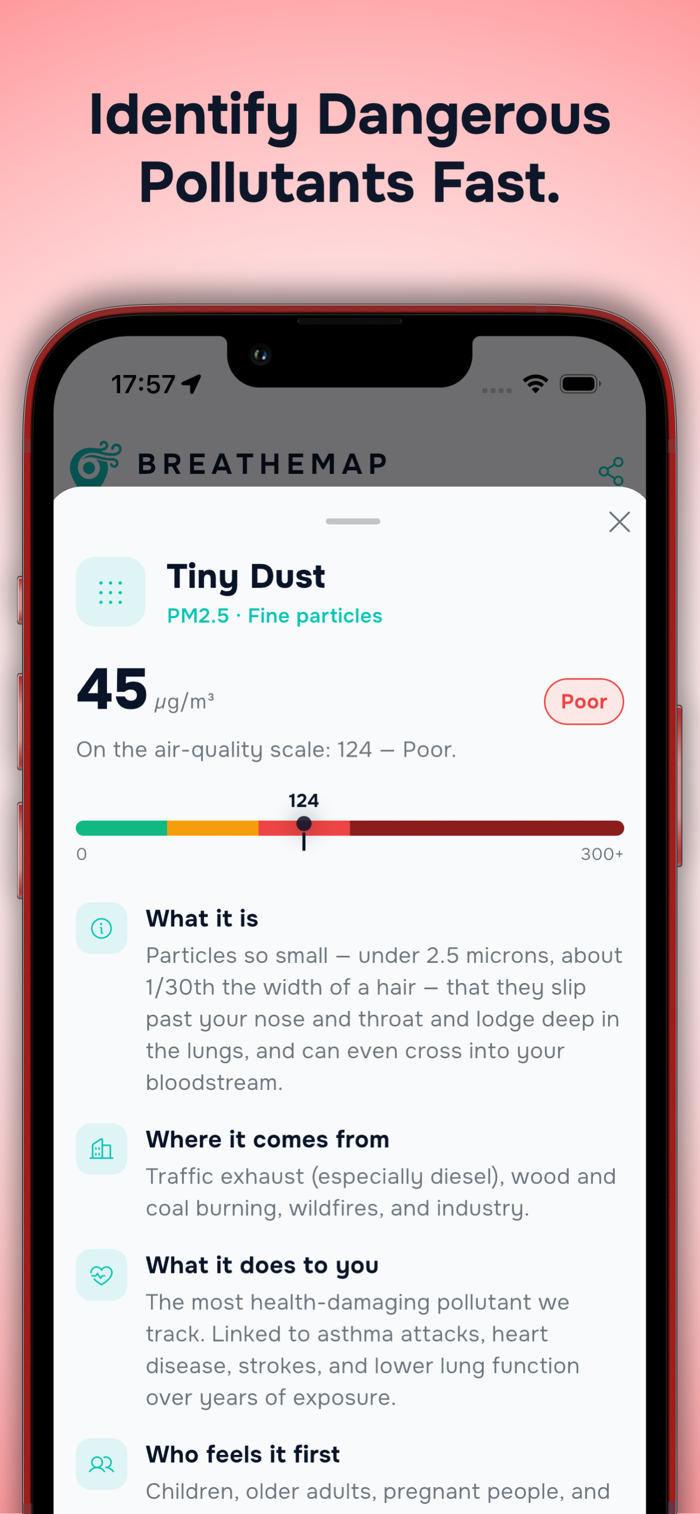
Live AQI at a glance. Eight pollutants tracked — PM2.5, PM10, ozone, nitrogen dioxide, sulfur dioxide, carbon monoxide, dust and ammonia. Tap any pollutant to understand what it is, how it feels, and who it hurts most. The science is there. You decide what to do.
ALLERGY ALERTS — EUROPE-WIDE.
Real pollen counts from Switzerland, Germany and across Europe. Star the pollens you actually react to. Get alerts when they rise at your places. Not guesses. Not "high pollen day." Your pollens, your places, your risk.
SAVED PLACES, TRACKED AUTOMATICALLY.
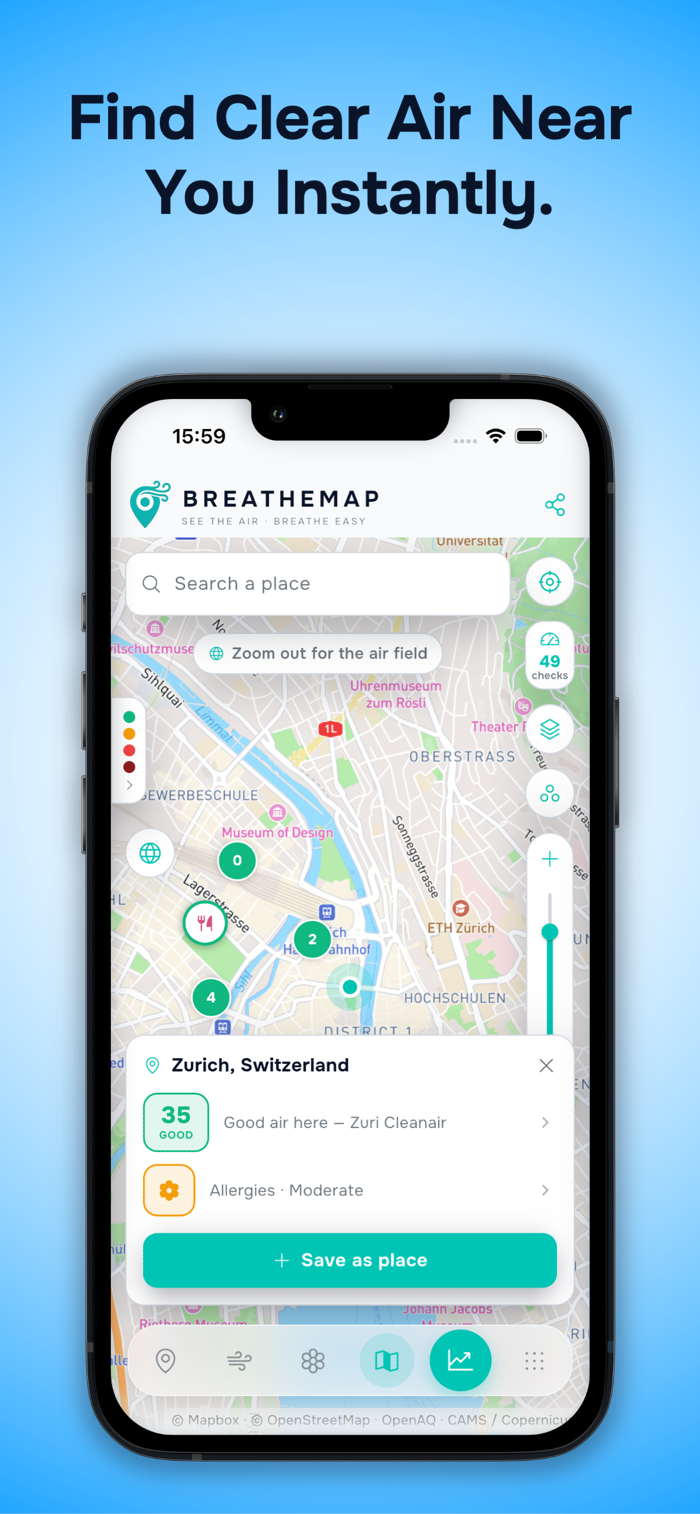
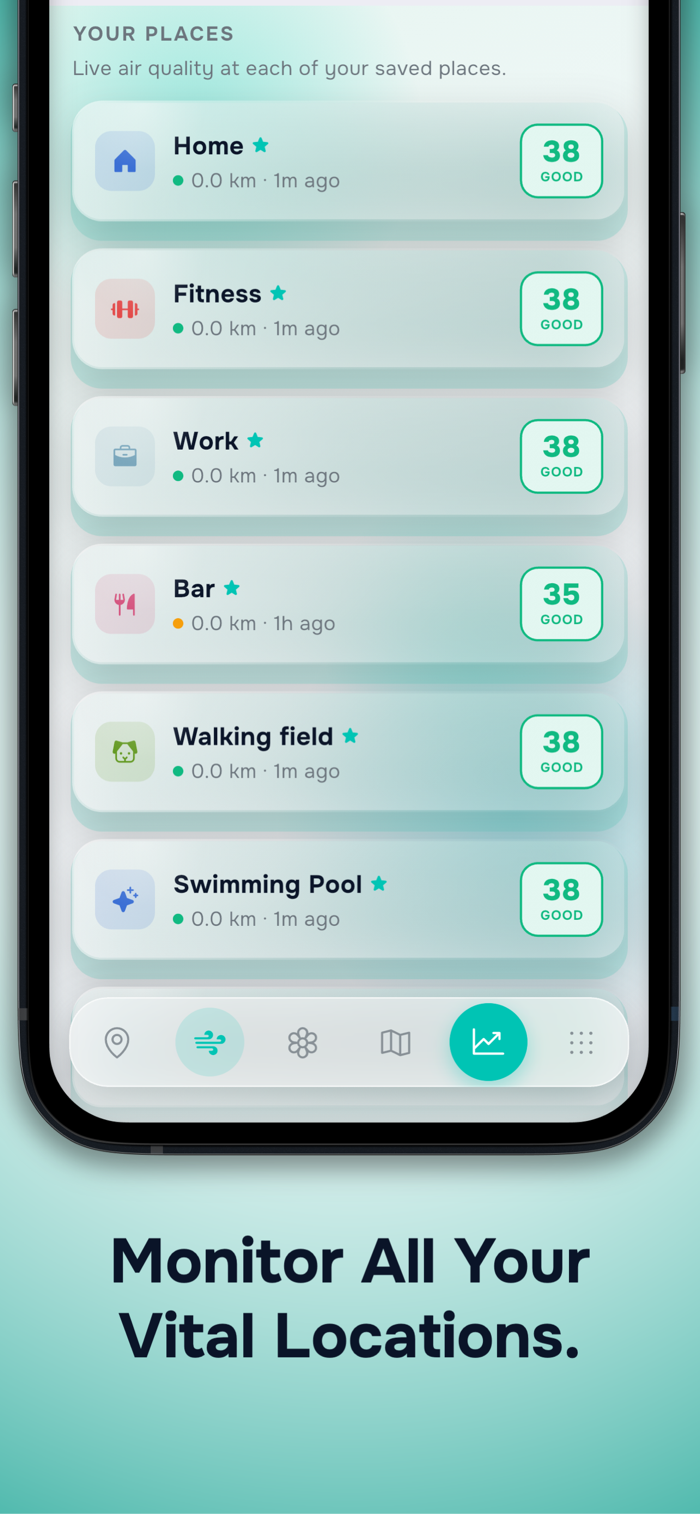
Add home, work, school, the gym, grandma's house — as many as you need. BreatheMap logs when you arrive and leave using your phone's location. No logging required. Your exposure history builds itself.
THE MAP TELLS THE WHOLE STORY.
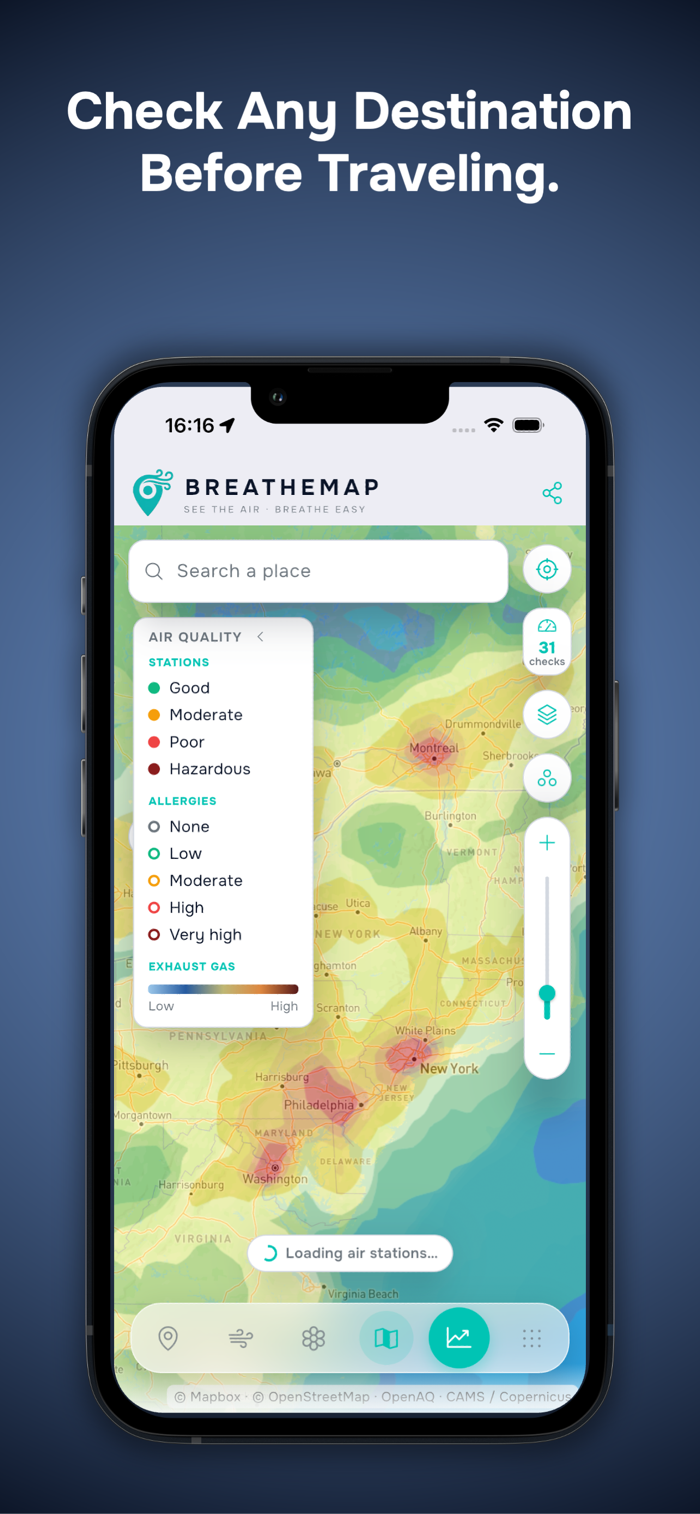
Worldwide air quality dots. Europe-wide pollen dots. Field overlays showing PM2.5, ozone, and more painted across the globe. A time slider lets you see yesterday, today, tomorrow and the next three days — the whole world breathes in forecast mode.
YOUR EXPOSURE HISTORY — A CLINICAL TOOL.
Three sections show what you breathed:
— Air exposure: AQI timeline, pollutant breakdown, worst days.
— Pollen exposure: species you encountered, seasonal trends.
— Place exposure: how long at each location and what the air was.
Export three CSVs or a branded PDF report. Hand it to your doctor. This is data that matters.
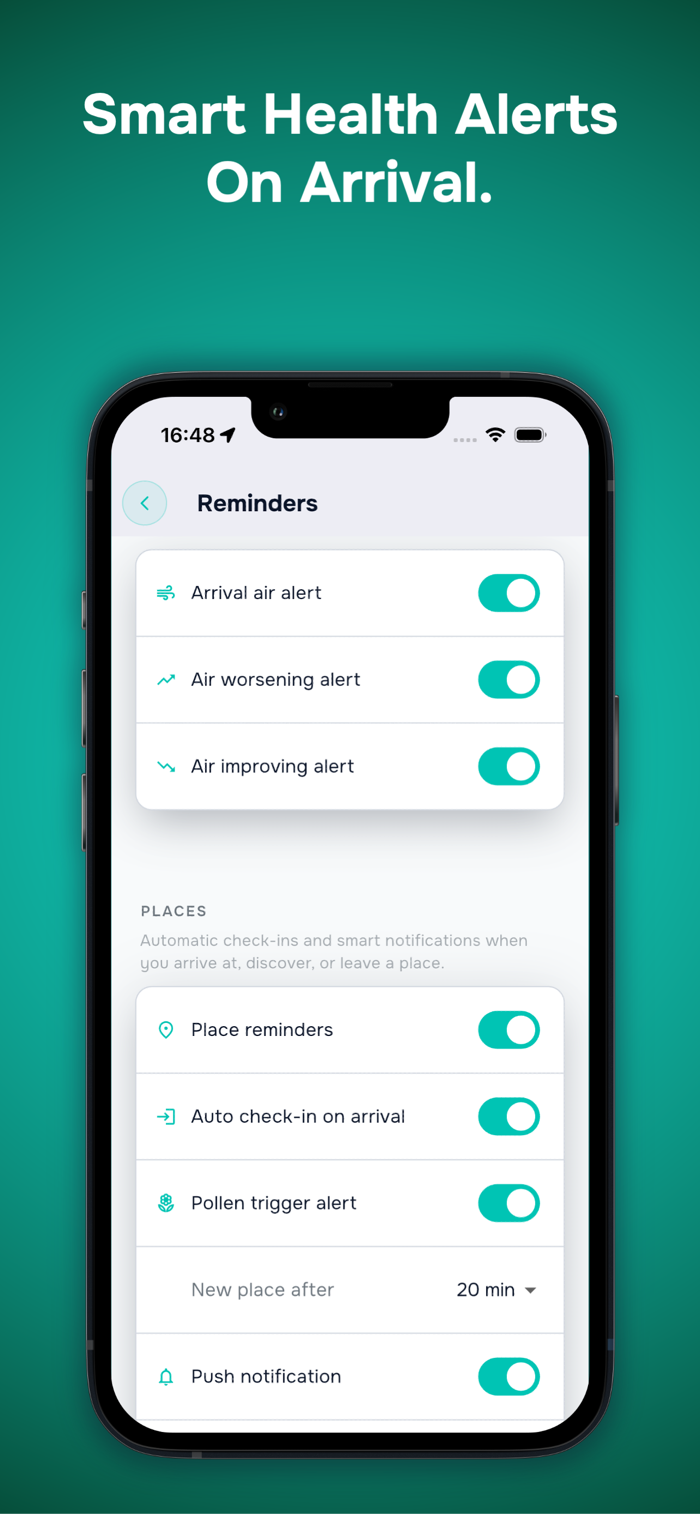
ARRIVAL ALERTS THAT ACTUALLY HELP.
When you get to a saved place, a notification tells you the air quality and gives you a real recommendation: open the window, close it, mask up, move your run indoors. Action-first, not fear-first.
HONEST SOURCING, ALWAYS.
Every reading shows you where it came from — a measured ground station (with the name and distance) or the Copernicus/CAMS scientific model. No black box. Full transparency.
SEVEN LANGUAGES. LIGHT AND DARK.
English, German, Spanish, French, Italian, Portuguese, Russian. Beautiful dark and light themes.
WHAT'S INSIDE BREATHEMAP:
· Air Quality — live 8-pollutant AQI worldwide (OpenAQ + Copernicus/CAMS)
· Pollen & Allergies — live counts and forecasts across Europe (MeteoSwiss, DWD, CAMS)
· Saved Places — auto check-in/out via location, per-place air and pollen
· Map — worldwide AQI dots, Europe pollen, field overlays, forecast time slider
· Exposure History — air timeline, pollen timeline, place exposure, 5-day forecasts
· Alerts — arrival alerts, air-change alerts, pollen alerts (premium)
· Exposure Reports — CSVs + branded PDF for your doctor
· Sharing — branded screenshots you can send anywhere
· Data & Privacy — Firestore (Google Cloud), fully localized legal terms, named processors
PLANS:
Start free with full air quality worldwide, pollen across Europe, saved places, auto check-in and exposure history. Get forecast strips and pollen alerts with Visionary (3-day free trial, no card required). Single purchase, lifetime access.
BreatheMap. See the air. Breathe easy.
Terms of Use (EULA): https://www.apple.com/legal/internet-services/itunes/dev/stdeula/


 +100宝石


 分享
分享










用户评价
立即分享产品体验
你的真实体验,为其他用户提供宝贵参考
💎 分享获得宝石
【分享体验 · 获得宝石 · 增加抽奖机会】
将你的产品体验分享给更多人,获得更多宝石奖励!
💎 宝石奖励
每当有用户点击你分享的体验链接并点赞"对我有用",你将获得:
🔗 如何分享
复制下方专属链接,分享到社交媒体、群聊或好友:
💡 小贴士
分享时可以添加你的个人推荐语,让更多人了解这款产品的优点!
示例分享文案:
"推荐一款我最近体验过的应用,界面设计很精美,功能也很实用。有兴趣的朋友可以看看我的详细体验评价~"
关注 Mergeek 公众号
领奖遇到问题?联系小门助手