













加入 Mergeek 福利群
扫码添加小助手,精彩福利不错过!
若不方便扫码,请在 Mergeek 公众号,回复 群 即可加入
- 精品限免
- 早鸟优惠
- 众测送码
 MCarloRisk
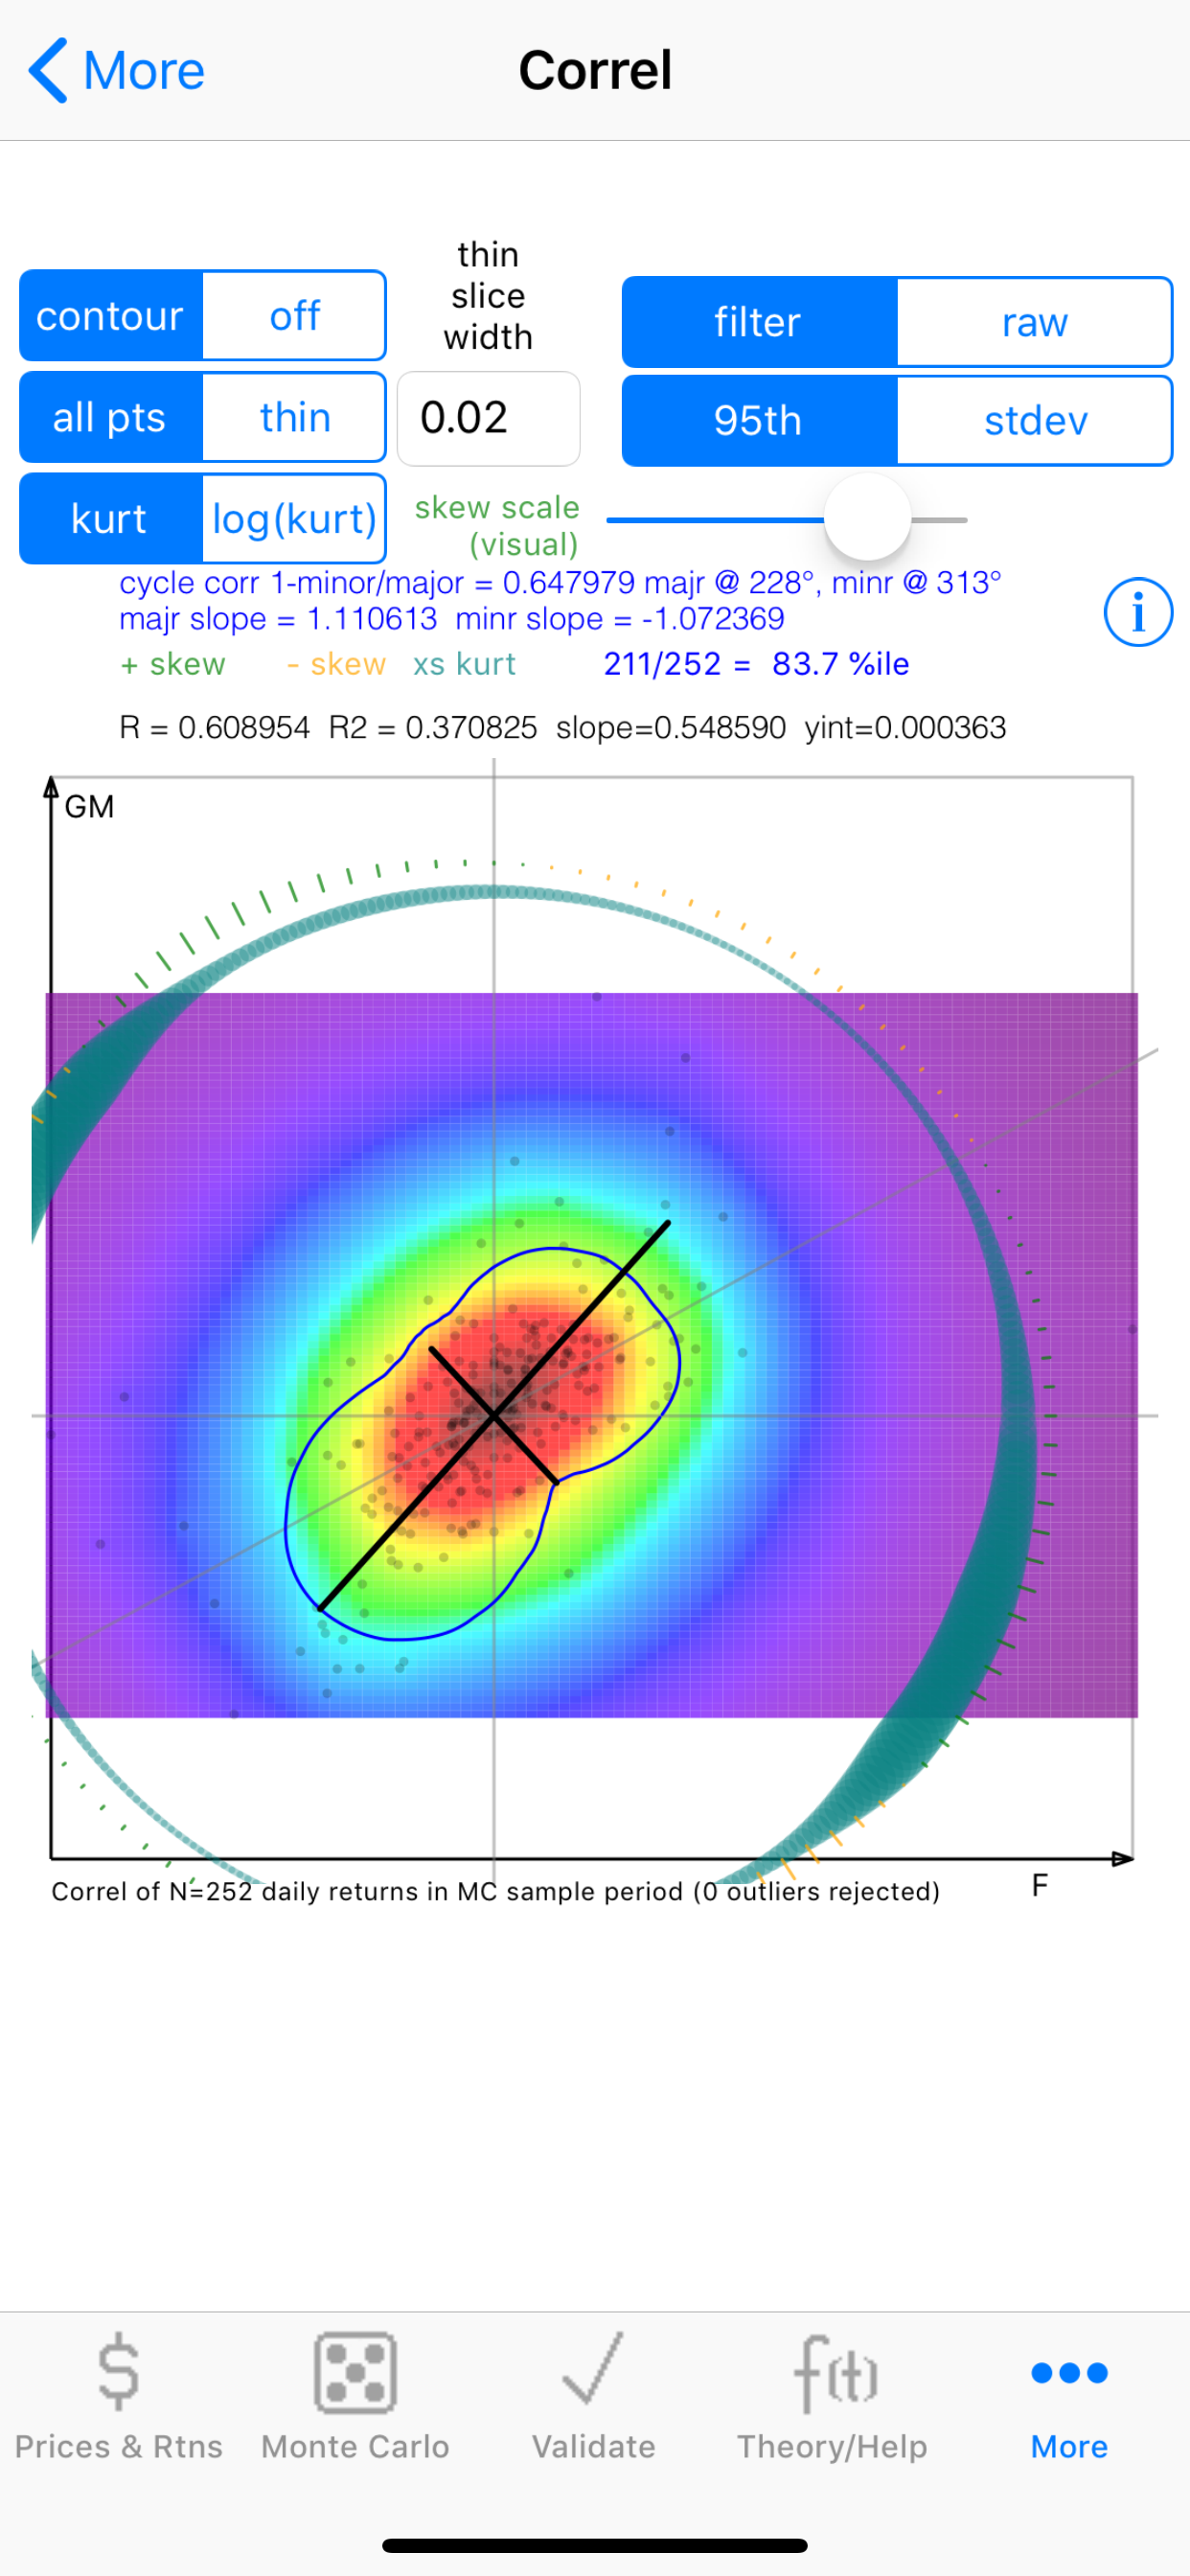
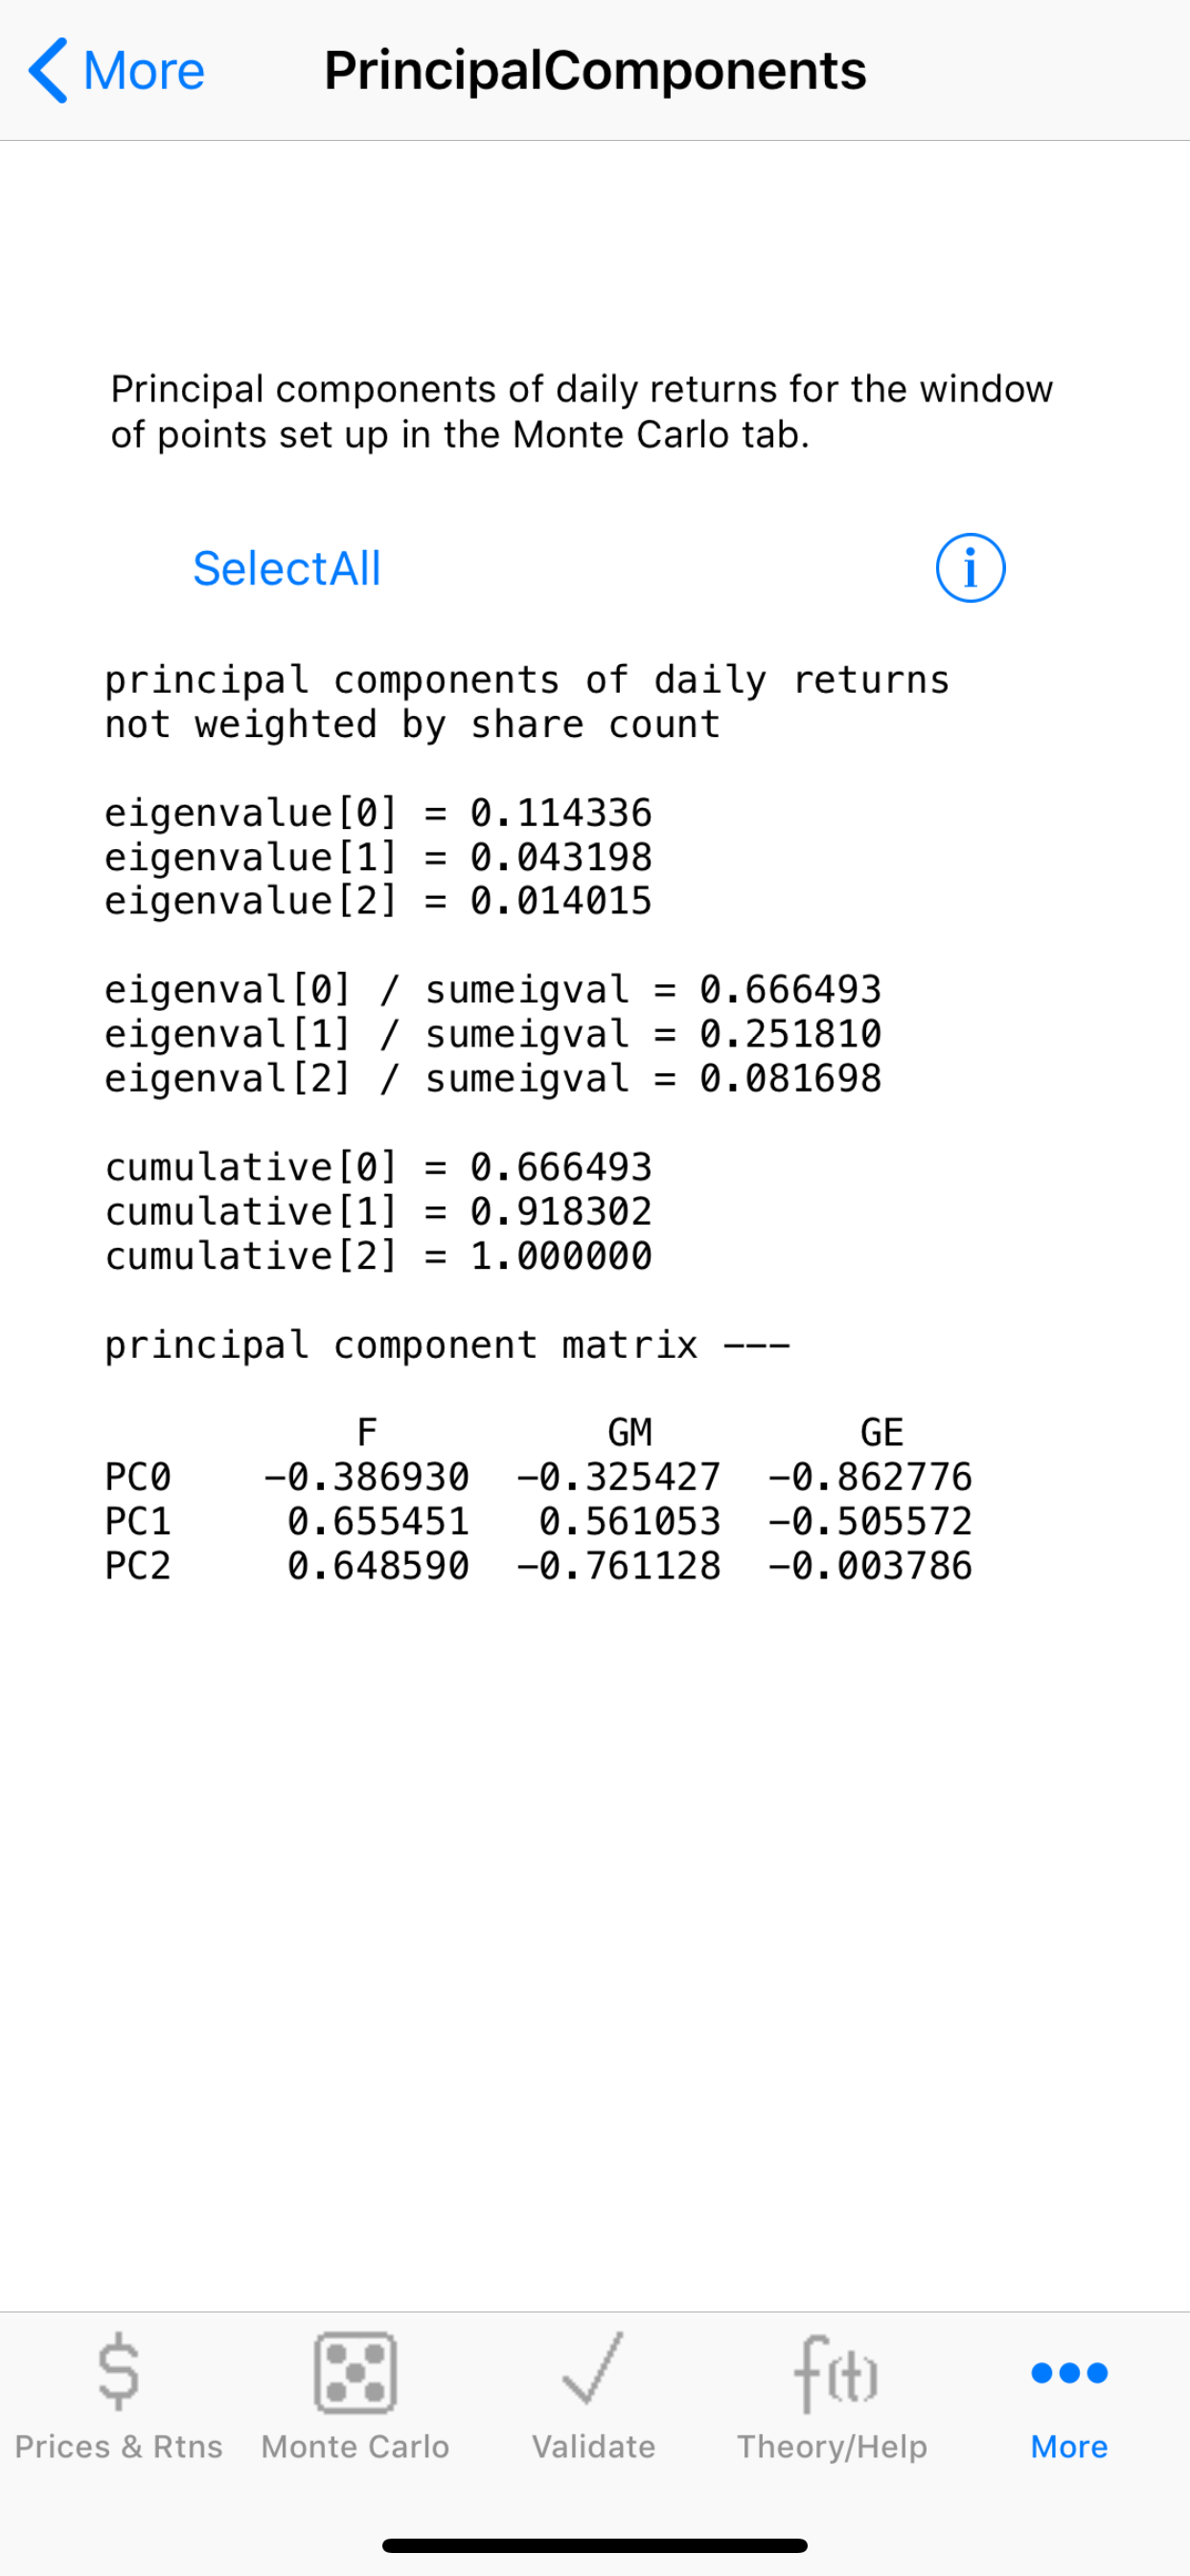
Stock price / probability risk analyzer & optimizer for the common man. See also our new support for top cryptocurrencies. Now with portfolio support, pairwise correlation/regression analysis of daily returns, and portfolio optimization. Computes forward (price,probability) for your share-weighted portfolio.
Unlike other folio optimizers, this code does not assume normality of returns, nor does it require to you enter volatility estimates...these are computed from public historical return data, and you can tell it how far back to look to compute the volatility. Try some optimizations and compare to results from other codes!
Main data feed is the innovative IEX.
Why rely on the tea leaves of chart reading when you can apply real statistics and historical resampled data to your analysis? While charting tools such as Bollinger bands, moving averages, and candlesticks are generated only on historical data, this app takes past data and remixes it via Monte Carlo methods to generate thousands of possible future price walks, then computes the probabilities of those price outcomes. Also works for stock-like ETFs and short ETFs (e.g. SH = short SPY).
Estimates future price distribution using random walk theory, where random samples are chosen from the history of the stock in question.
User can control how far back in time to use historical data to capture only the current "epoch" or to take into account long term historical behavior.
Built-in backtesting, verification, and model tuning tools.
-- Details --
This app models daily stock returns as a stable stochastic process and estimates a future price distribution by Monte Carlo re-sampling from an "empirical distribution" of a user-specified subset of prior (known) daily returns.
Be sure to press the Run Monte button on the Monte Carlo tab after changing settings or downloading a new data set.
This app downloads historical data from IEX as base data to resample. Prices are converted to daily returns [P(t)/P(t-1)] before resampling. The user can choose how far back to resample. By estimating a probability distribution of future prices at the user-specified investment horizon in this manner, we can give risk-of-loss estimates in thumb-rule fashion, to a first approximation.
Reports out estimated price and %loss estimates at the commonly used levels of 1st percentile and 5th percentile (1% and 5% risk). Also reports out median (50th percentile) price estimates at the given number of days forward. Calculations are performed on daily Closing price data. An artificial shock filter is provided, which can be used to reject the resampling of prior returns that are artificially large (due to splits or other artificial re-valuations that do not affect the underlying value of the asset). Theory of operation is described in detail under the Theory tab.
The stochastic model may be tuned or calibrated by adjusting the maximum number of days backwards to sample and/or a back in time linear weighting.
Stochastic Model Validation (backtest) features:
On the Monte Carlo tab, you can withhold any number of recent days from the model and then plot the results of the stochastic risk forecast as lower-bound envelopes at 1% and %5 and all other estimated probability (risk) levels dynamically after the model run is completed.
Validate tab:
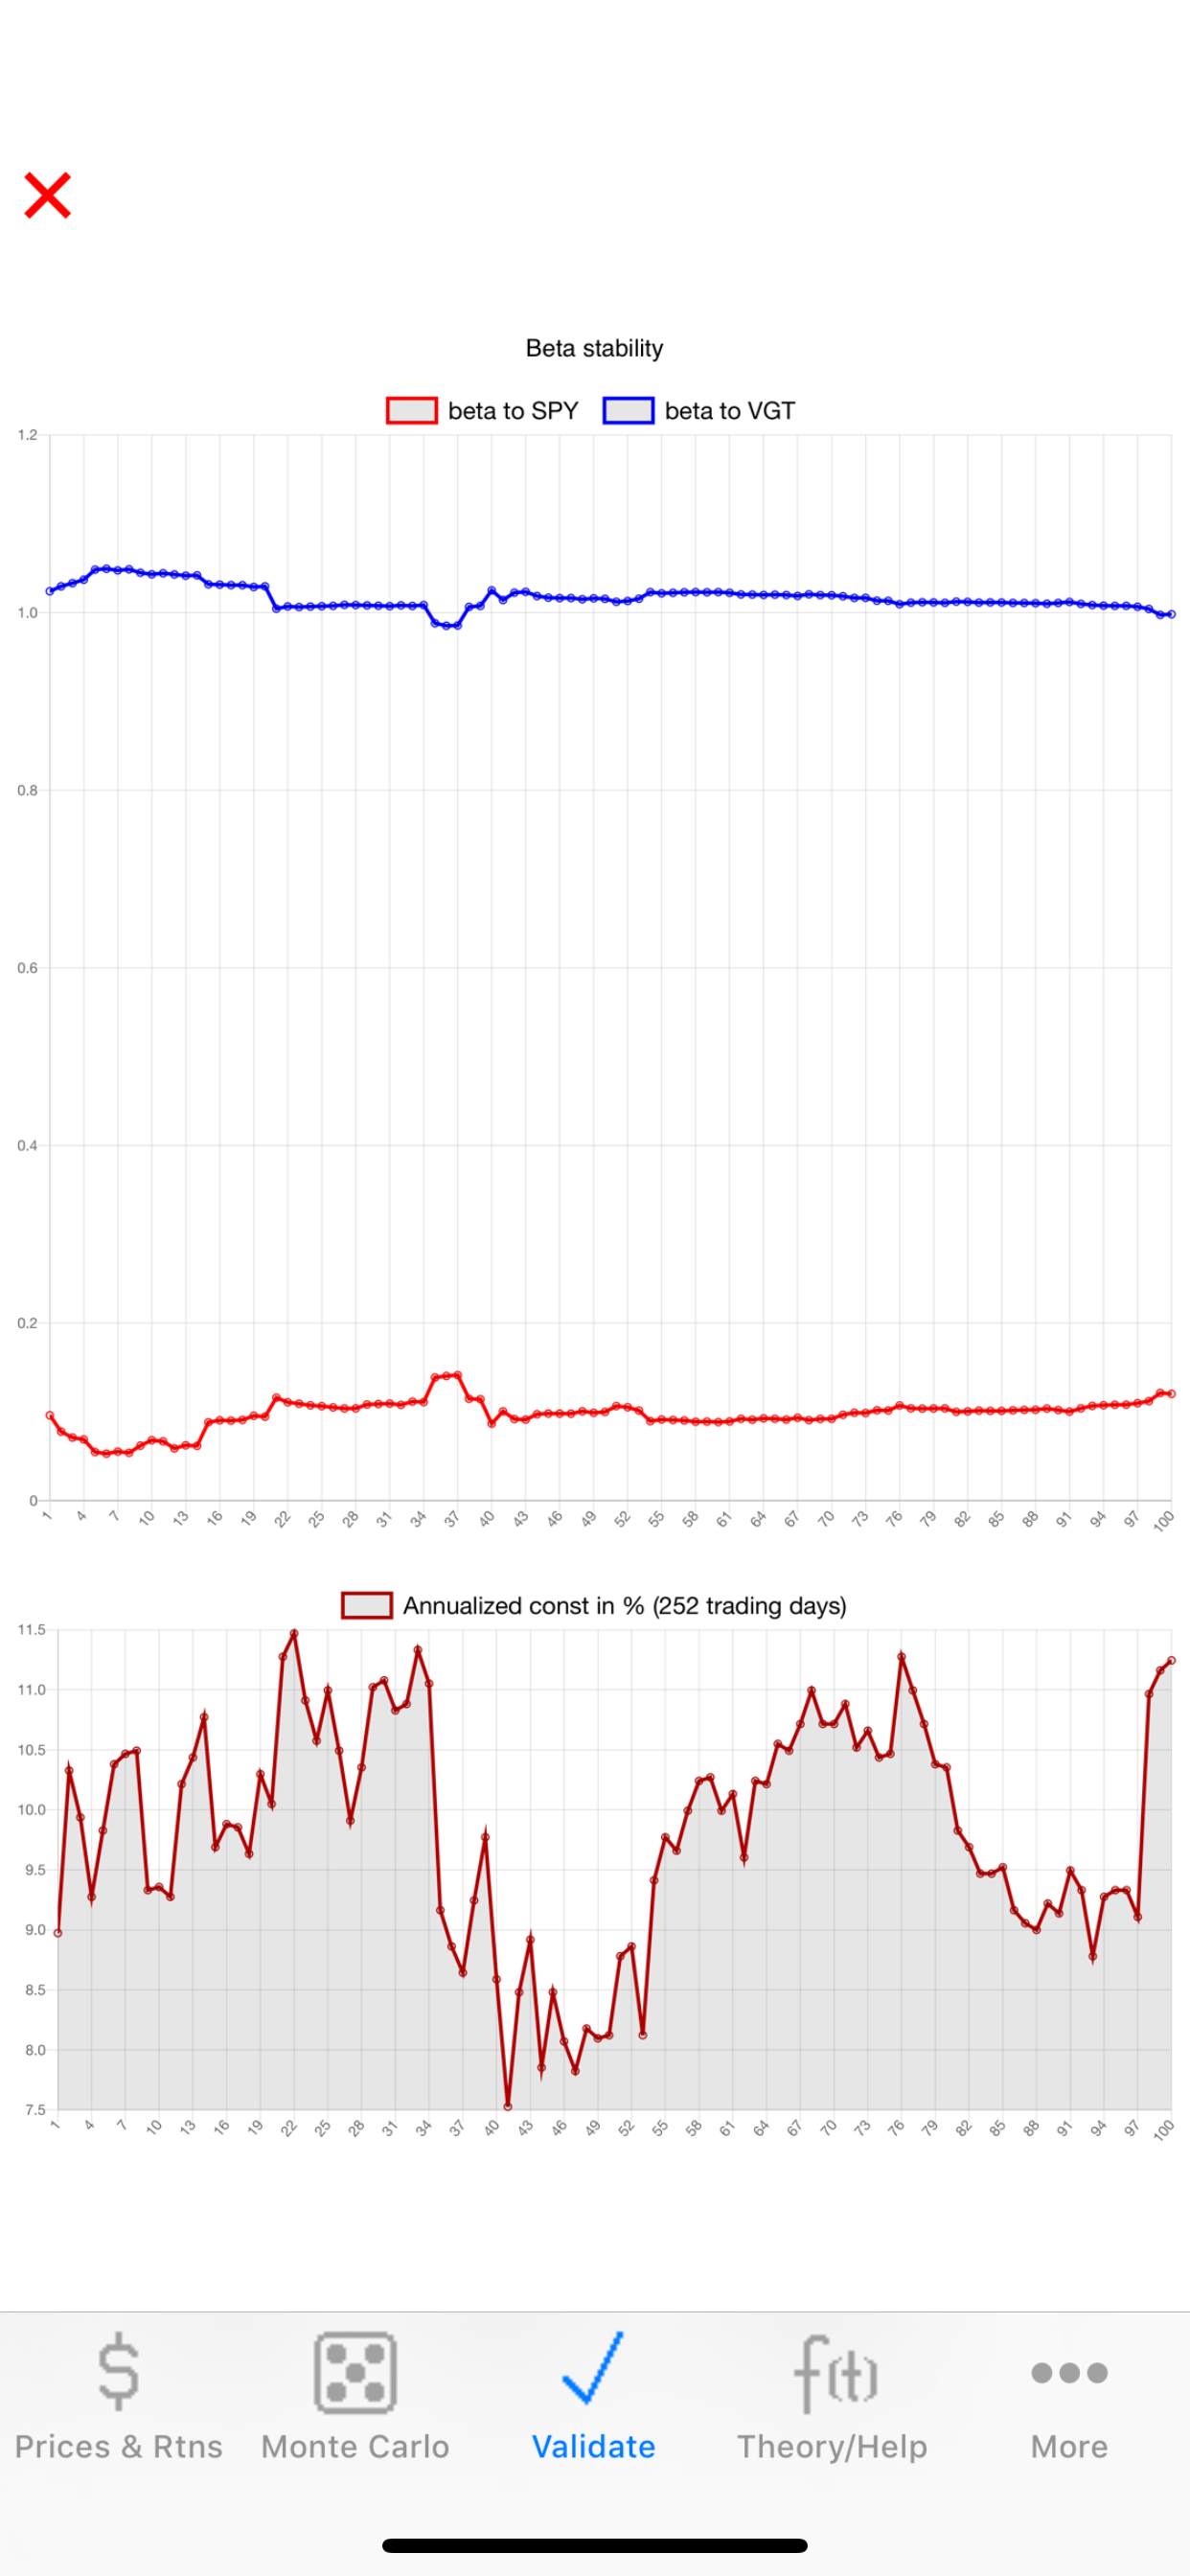
This allows you to perform an exhaustive validation on your model by withholding several points, computing the model, comparing the forward prediction of the model versus the actual reserved data, and repeating this over time for all withheld points.
The app provider makes no claims as to the suitability of this app for any purpose whatsoever, and the user should consult an investment advisor before making investment decisions.
Stock price / probability risk analyzer & optimizer for the common man. See also our new support for top cryptocurrencies. Now with portfolio support, pairwise correlation/regression analysis of daily returns, and portfolio optimization. Computes forward (price,probability) for your share-weighted portfolio.
Unlike other folio optimizers, this code does not assume normality of returns, nor does it require to you enter volatility estimates...these are computed from public historical return data, and you can tell it how far back to look to compute the volatility. Try some optimizations and compare to results from other codes!
Main data feed is the innovative IEX.
Why rely on the tea leaves of chart reading when you can apply real statistics and historical resampled data to your analysis? While charting tools such as Bollinger bands, moving averages, and candlesticks are generated only on historical data, this app takes past data and remixes it via Monte Carlo methods to generate thousands of possible future price walks, then computes the probabilities of those price outcomes. Also works for stock-like ETFs and short ETFs (e.g. SH = short SPY).
Estimates future price distribution using random walk theory, where random samples are chosen from the history of the stock in question.
User can control how far back in time to use historical data to capture only the current "epoch" or to take into account long term historical behavior.
Built-in backtesting, verification, and model tuning tools.
-- Details --
This app models daily stock returns as a stable stochastic process and estimates a future price distribution by Monte Carlo re-sampling from an "empirical distribution" of a user-specified subset of prior (known) daily returns.
Be sure to press the Run Monte button on the Monte Carlo tab after changing settings or downloading a new data set.
This app downloads historical data from IEX as base data to resample. Prices are converted to daily returns [P(t)/P(t-1)] before resampling. The user can choose how far back to resample. By estimating a probability distribution of future prices at the user-specified investment horizon in this manner, we can give risk-of-loss estimates in thumb-rule fashion, to a first approximation.
Reports out estimated price and %loss estimates at the commonly used levels of 1st percentile and 5th percentile (1% and 5% risk). Also reports out median (50th percentile) price estimates at the given number of days forward. Calculations are performed on daily Closing price data. An artificial shock filter is provided, which can be used to reject the resampling of prior returns that are artificially large (due to splits or other artificial re-valuations that do not affect the underlying value of the asset). Theory of operation is described in detail under the Theory tab.
The stochastic model may be tuned or calibrated by adjusting the maximum number of days backwards to sample and/or a back in time linear weighting.
Stochastic Model Validation (backtest) features:
On the Monte Carlo tab, you can withhold any number of recent days from the model and then plot the results of the stochastic risk forecast as lower-bound envelopes at 1% and %5 and all other estimated probability (risk) levels dynamically after the model run is completed.
Validate tab:
This allows you to perform an exhaustive validation on your model by withholding several points, computing the model, comparing the forward prediction of the model versus the actual reserved data, and repeating this over time for all withheld points.
The app provider makes no claims as to the suitability of this app for any purpose whatsoever, and the user should consult an investment advisor before making investment decisions.
第一时间掌握精选限免应用/游戏信息
自定义喜欢的应用/游戏的价格变动
了解内购应用/游戏的限免或降价活动
查看应用/游戏价格历史等待合适时机再出手
第一时间收到价格通知不错过省钱机会

扫码下载 Follow
 ToChart
ToChart 是一款免费的数据可视化工具,支持直连 MySQL、PostgreSQL 等主流数据库...

 柚子助眠
柚子助眠
柚子助眠,地球人都在用的健康睡眠新概念应用小助手。Phone必备App神器.每一个热爱生活的人,都值...
 小象upup
一款轻便的日程和人际(客户)关系管理应用,个人成长效率助手,具有日程管理、项目协同、人脉管理、备忘记...
 9
9


ToChart 是一款免费的数据可视化工具,支持直连 MySQL、PostgreSQL 等主流数据库...
9


柚子助眠,地球人都在用的健康睡眠新概念应用小助手。Phone必备App神器.每一个热爱生活的人,都值...
5

一款轻便的日程和人际(客户)关系管理应用,个人成长效率助手,具有日程管理、项目协同、人脉管理、备忘记...
天天发现优质应用
 到主屏幕
到主屏幕


产品名
这项是必须填的哦~可用平台
产品链接
这项是必须填的哦~产品一句话介绍
这项是必须填的哦~开发者邮箱
你也可以发送更多的产品故事到 hi@mergeek.com
我们会让你的产品被更多用户看到!
产品名
这项是必须填的哦~可用平台
产品链接
这项是必须填的哦~产品一句话介绍
这项是必须填的哦~开发者邮箱
你也可以发送更多的产品故事到 hi@mergeek.com
我们会让你的产品被更多用户看到!
已经成功发送到你的邮箱了,请注意查收
你成为这个产品的发现者啦,说说你的推荐语吧!